Generations before us, folks paid pennies to send a letter across the country. But times have changed and over the decades, the price of a stamp has ballooned from only a few cents to almost half a dollar. The table below charts the precise stamp price increases and the dates of their introductions. Using the table, you can get an idea of how the price of a stamp has changed over a timeline of over 100 years in the United States.
Before you see the table, you might like to understand the changes it demonstrates. Although it seems like the price of a stamp has risen at an alarming rate, this mostly has to do with inflation. Let’s find out why. The graph below depicts the price of a first class stamp in two different ways: the dark blue section shows the actual price of a stamp as it’s listed in this table against the year the price was in effect; the second shaded section in light blue shows the inflation adjusted price of a stamp using the value of US cents in 2008.
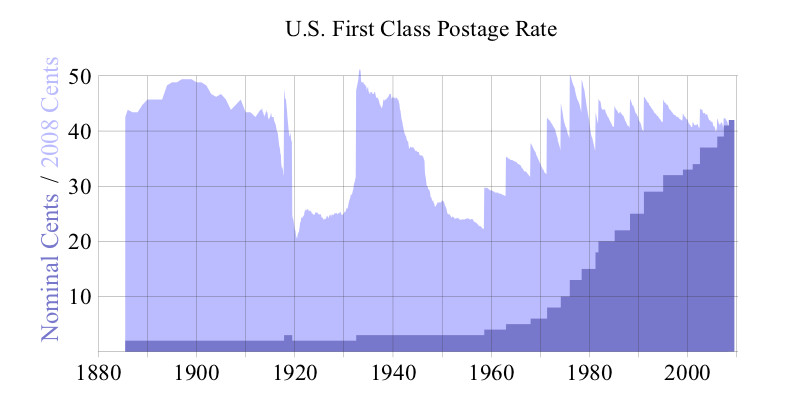
The price of a stamp over time compared to its inflation-adjusted price.
This inflation-adjusted graph proves that the price of a stamp has remained surprisingly stable over more than a century. This is because even though the cost of postage was increasing steadily, the value of the US dollar was inflating. That inflation means that the purchasing power of the cent was going down. With the purchasing power falling and the prices going up simultaneously, the net result is a stable stamp price.
Some of the sudden jumps up and down in the graph can just be explained by some of the the earliest stamp price changes. If you look at the table below you can see that since the stamp price was so low, an increase of just a cent means a relative increase of 50% or more. Were it reasonable to change the price of a stamp in increments of partial cents, there would be a less perceptible change in those areas of the graph. So, these changes had less to do with irrational inflation or pricing and more to do with relative changes in price.
| Date of Price Change | Price of a Stamp in Dollars |
| 03/03/63 | .06 (.03 per half ounce) |
| 03/03/83 | .04 (.02 per half ounce) |
| 07/01/85 | 0.02 |
| 11/03/17 | 0.03 |
| 07/01/19 | 0.02 |
| 07/01/28 | 0.02 |
| 07/06/32 | 0.03 |
| 01/01/52 | 0.03 |
| 08/01/58 | 0.04 |
| 01/07/63 | 0.05 |
| 01/07/68 | 0.06 |
| 05/16/71 | 0.08 |
| 03/02/74 | 0.10 |
| 09/14/75 | 0.10 |
| 12/31/75 | 0.13 |
| 05/29/78 | 0.15 |
| 03/22/81 | 0.18 |
| 11/01/81 | 0.20 |
| 02/17/85 | 0.22 |
| 04/03/88 | 0.25 |
| 02/03/91 | 0.29 |
| 01/01/95 | 0.32 |
| 01/10/99 | 0.33 |
| 01/07/01 | 0.34 |
| 07/01/01 | 0.34 |
| 06/30/02 | 0.37 |
| 01/08/06 | 0.39 |
| 05/14/07 | 0.41 |
| 05/12/08 | 0.42 |
| 05/11/09 | 0.44 |
| 04/17/11 | 0.44 |
| 01/22/12 | 0.45 |
| 01/27/13 | 0.46 |
Here’s just one of many excellent resources on the stamp price’s history and its changes relative to inflation.